Monitoring
# Overview
The Zenaton dashboard offers full visibility into all workflow executions and errors. The dashboard provides real time visuals for all workflows and tasks as well as activity for each Agent.
It can be accessed by anyone on the team and offers a full toolset to identify and troubleshoot errors and retry tasks when they fail.
# Workflows monitoring
Workflow monitoring offers a high level view of all the tasks and shows the sequence of events within a workflow. It also provides details on each task and errors so that problems can be quickly identified and fixed.
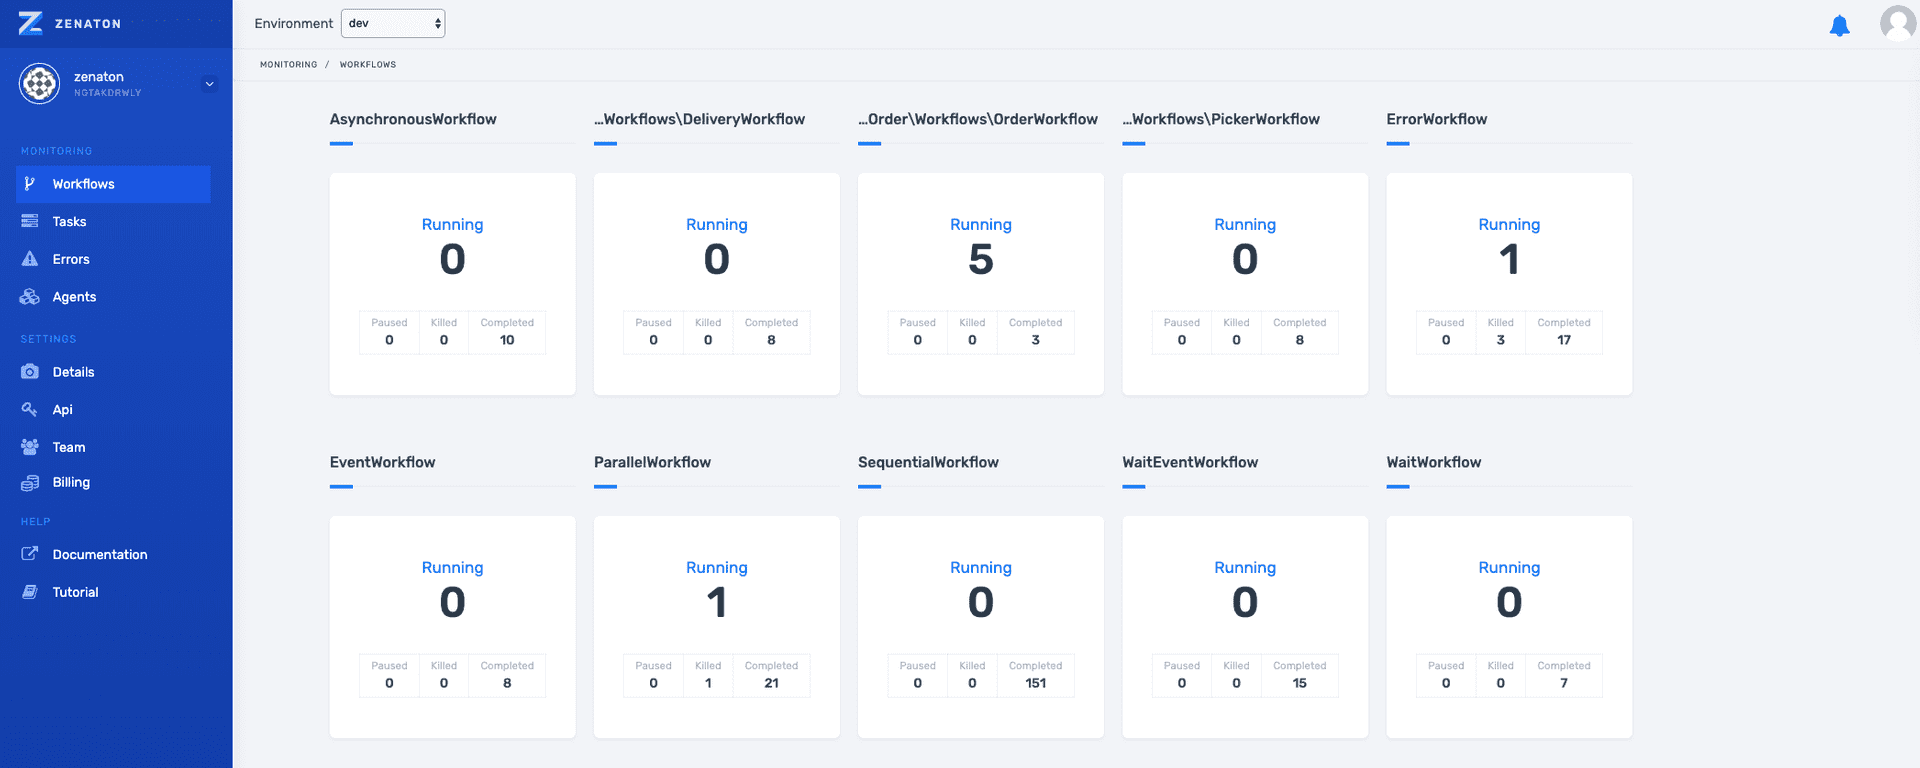
The dashboard provides a clear and real-time view of the number of workflows running, as well as how many were killed or completed.
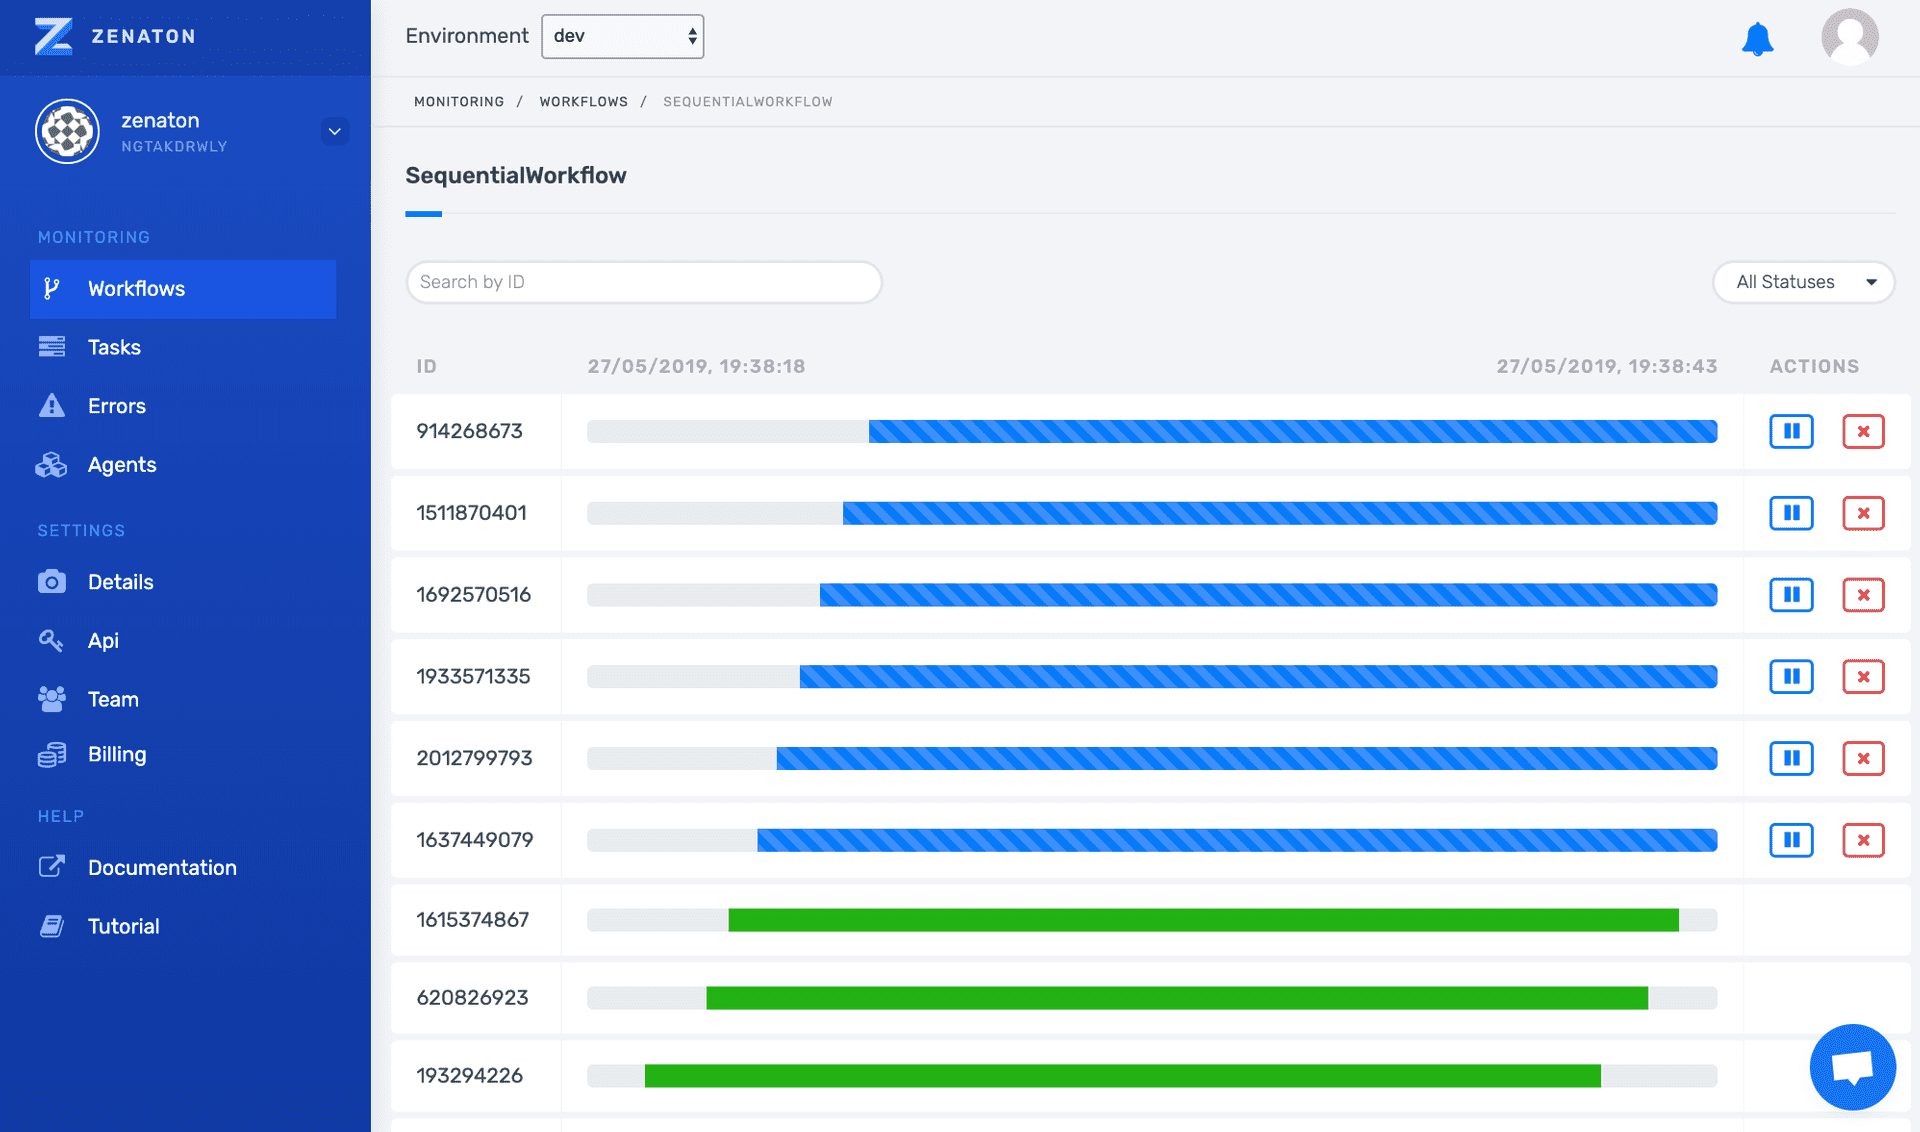
# Workflow Instances
For a specific workflow type, we can see — in real-time — a representation of workflow instances.
Sort by status (in progress or completed)
Search a specific workflow instance
Pause and restart a workflow instance
Kill a workflow instance
# Workflow Details
Click on a workflow instance to view all of the ongoing or completed tasks and metadata.
View when the workflow was dispatched and completed or killed.
View activity after a workflow has been killed
Visualize the changes in a workflow’s internal properties
Pause/restart a workflow that is in progress or retry if it has failed (not shown)
# Task Details
Click on an individual task in the workflow to view the properties, output or processing history.
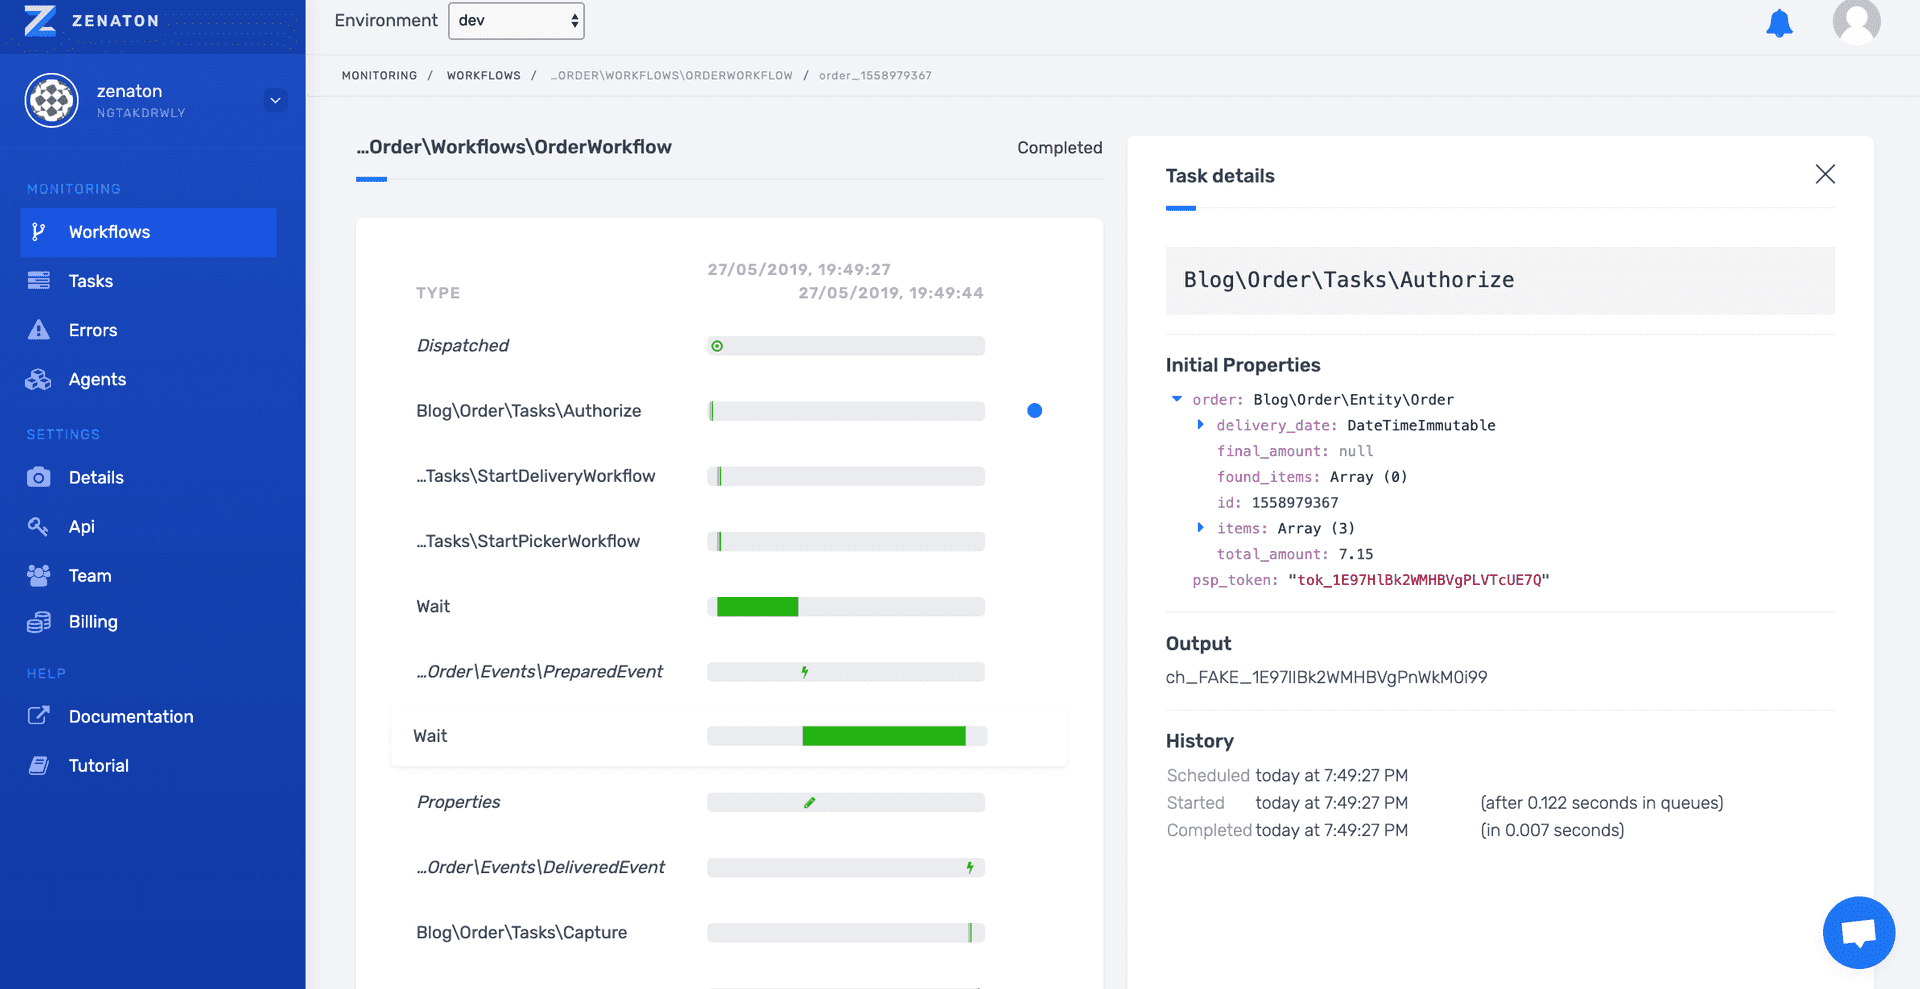
Note that if a job has failed, you will be able to see the error and stack trace here and manually retry the job.
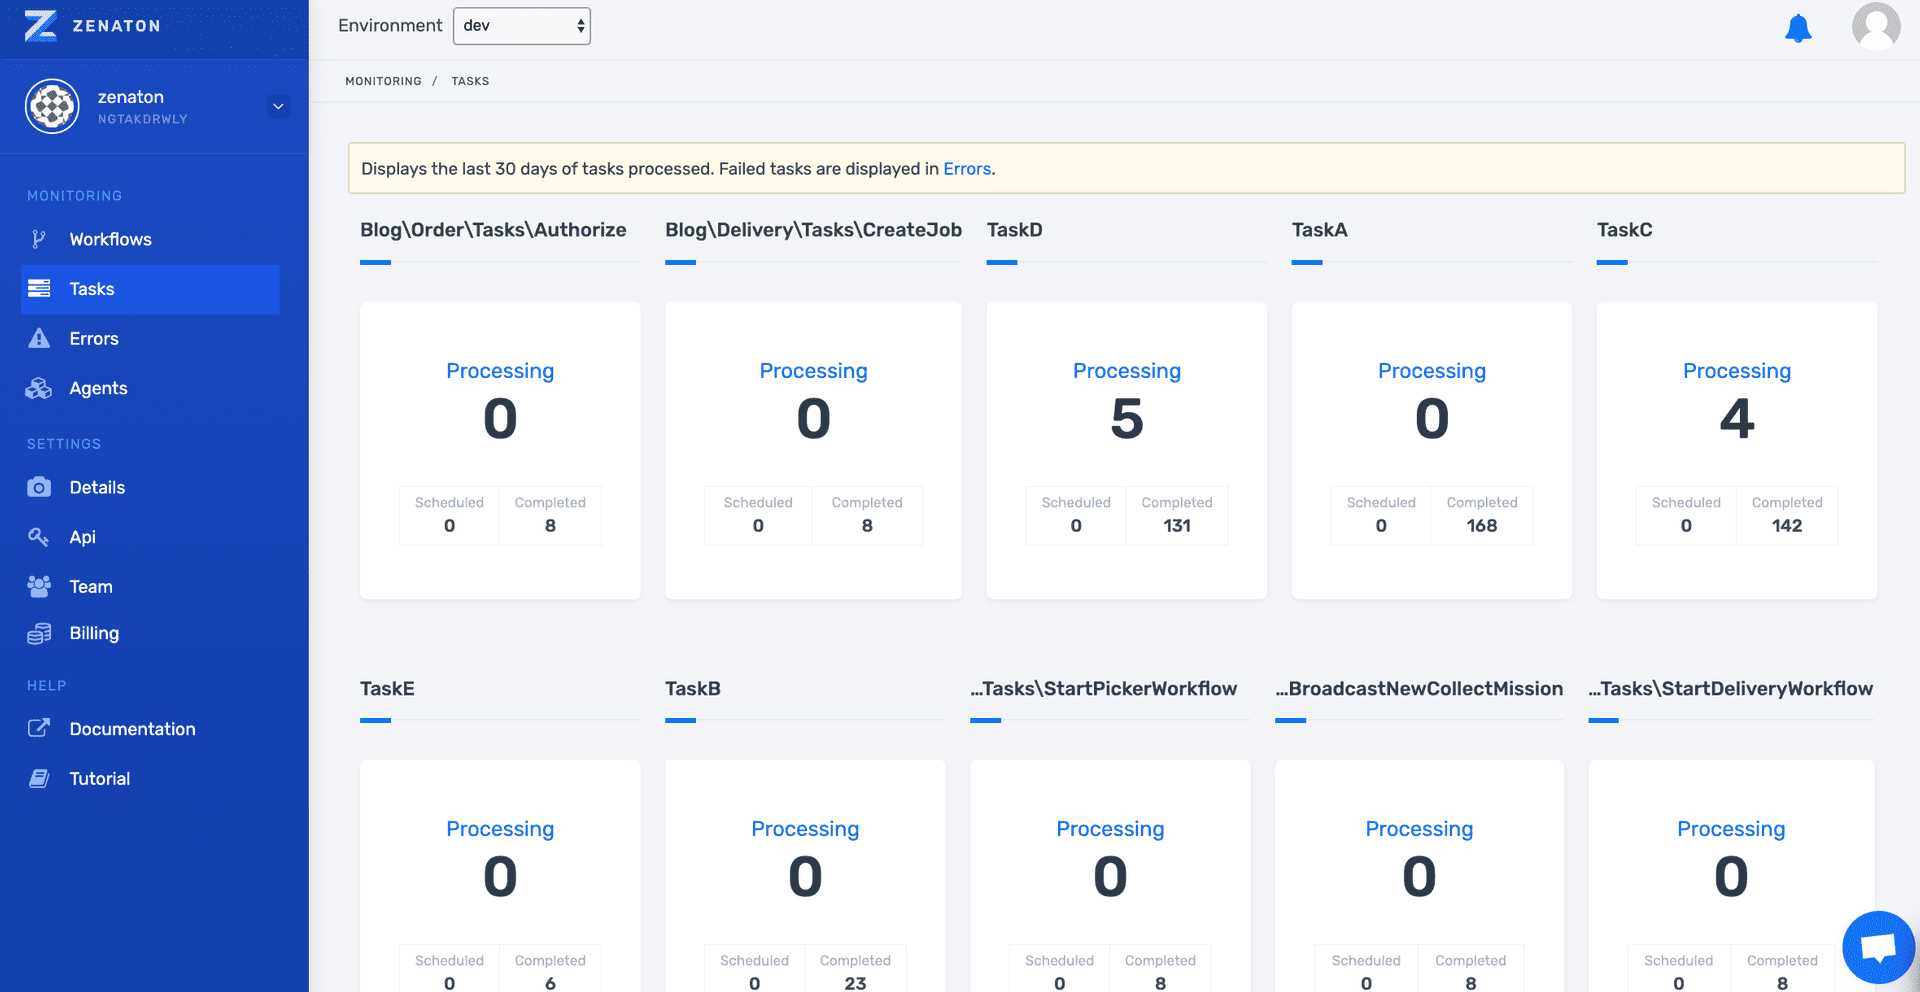
# Tasks monitoring
View the previous 30 days of task instances grouped by type of task. This will allow you to see the history of each type of task regardless of whether they were executed as a standalone task or workflow - or even as part of multiple workflows.
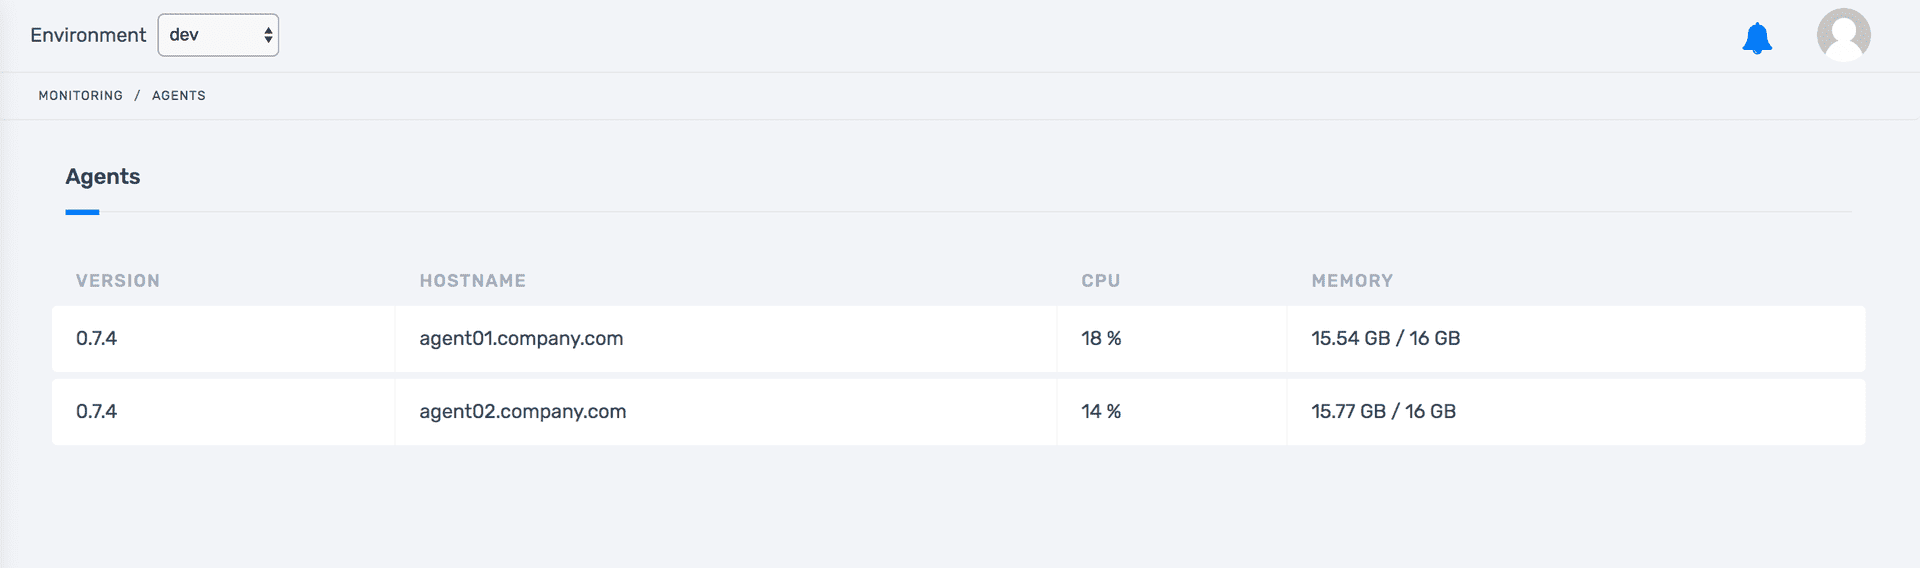
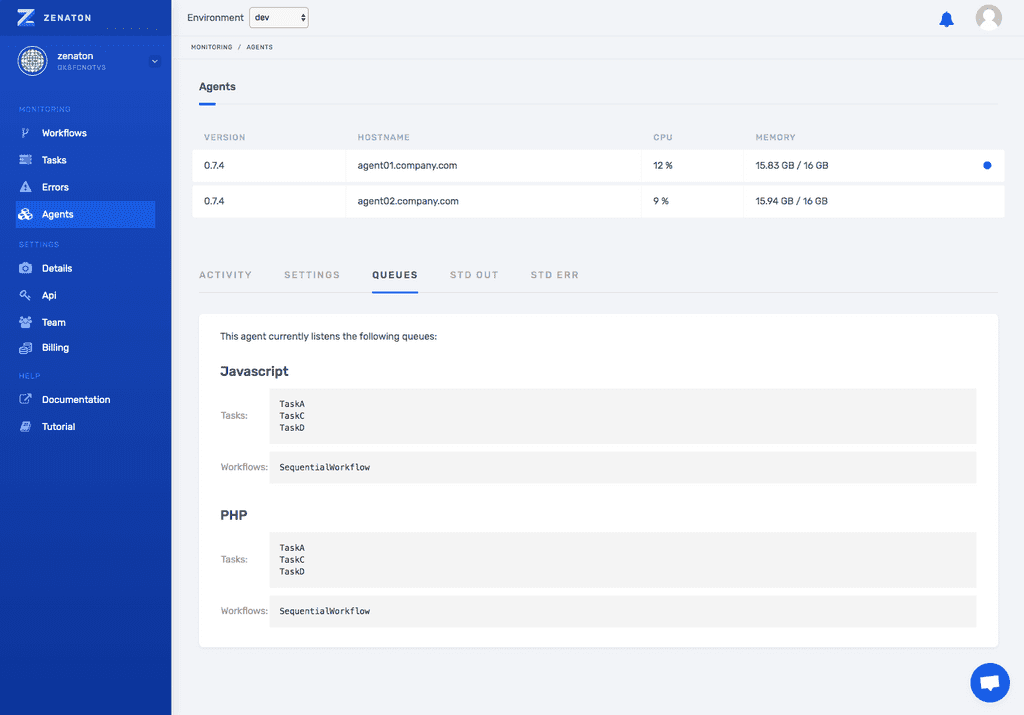
# Agents monitoring
View a real time overview of your connected Agents. This allows you to verify that the Agents are installed and running as they should. If there is a problem, you can quickly troubleshoot and fix it.
A list of all installed Agents with CPU and RAM usage
Real-time activity per Agent (tasks running)
Tasks and workflows that are assigned to that Agent that are configured at deployment
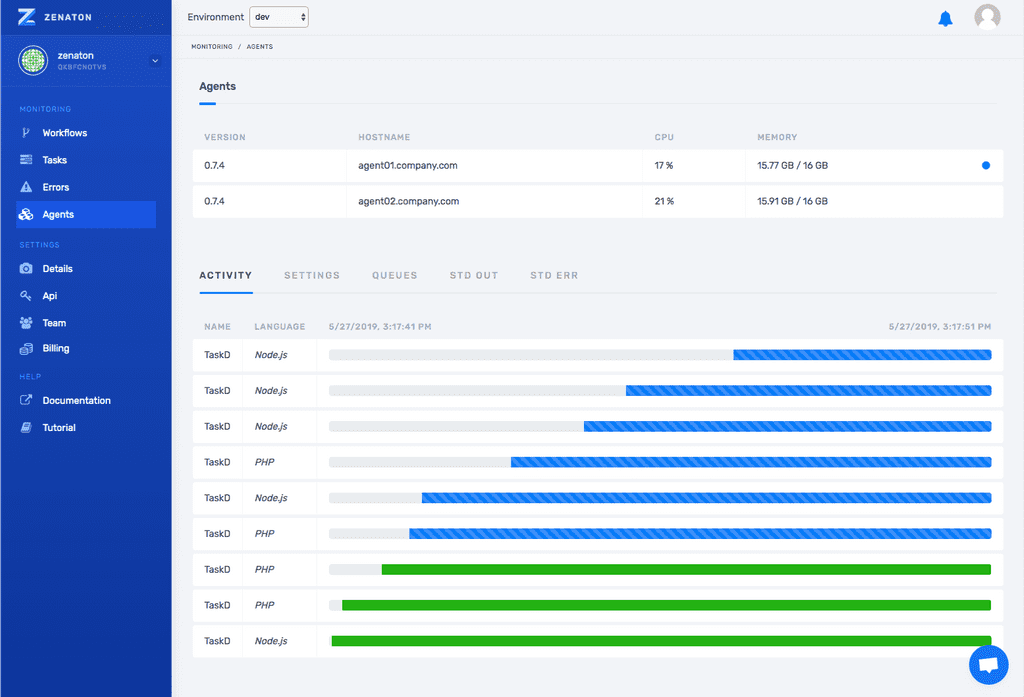
Select an Agent to view more information.
# Activity Tab
Watch a real-time progression of tasks being executed on the Agent for standalone tasks as well as tasks that are part of workflows.
# Settings Tab
View the that are currently in use by our Agent which you set during deployment (mostly what you have set in the .env file)
Shows which types of tasks an Agent is configured to execute
Confirm that all settings are configured as expected
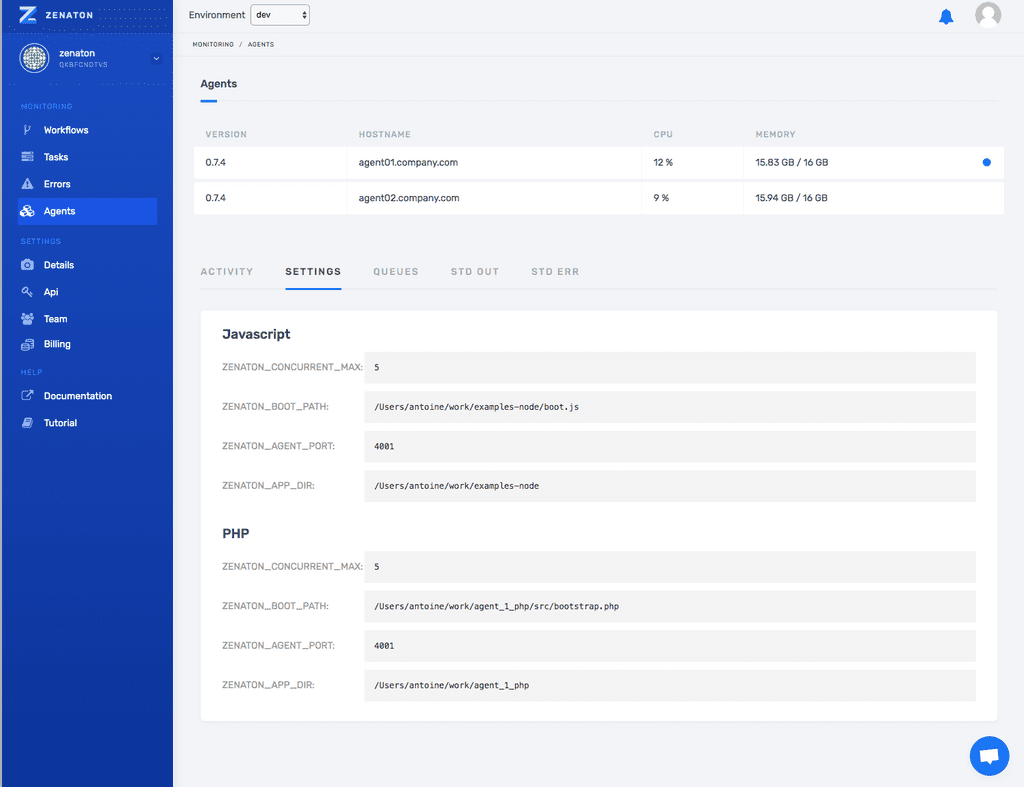
The settings tab is useful to make sure that the parameters match your expectations, for example after a new Agent configuration deployment.
Note: normally tasks are distributed evenly over all Agents but the Agent can be configured to run specific types of tasks to optimize performance.
# Queues Tab
Zenaton dynamically deploys a queue for each new type of task or workflow encountered. Agents are dynamically configured to listen those queues — according to their own configuration.
So, the queue tab shows a list of all tasks or workflows that have been assigned to that Agent and have run or started to run. This allows you to see the capability of the Agent — what tasks or workflows are allowed to run.
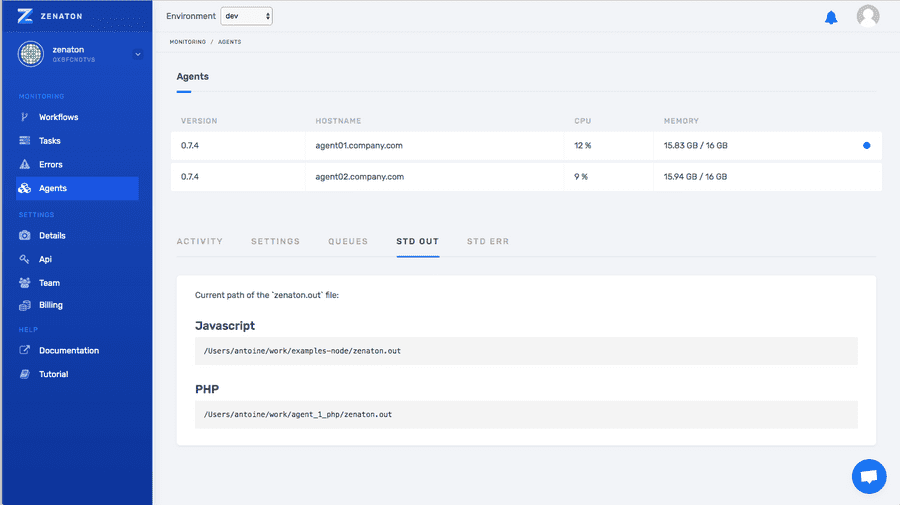
# STD OUT & STD ERR
While an Agent is running tasks, the output is written to two files: zenaton.out for std-out and zenaton.err for std-err.
Those tabs respectively give us the paths of the zenaton.out and zenaton.err files on our Agent.